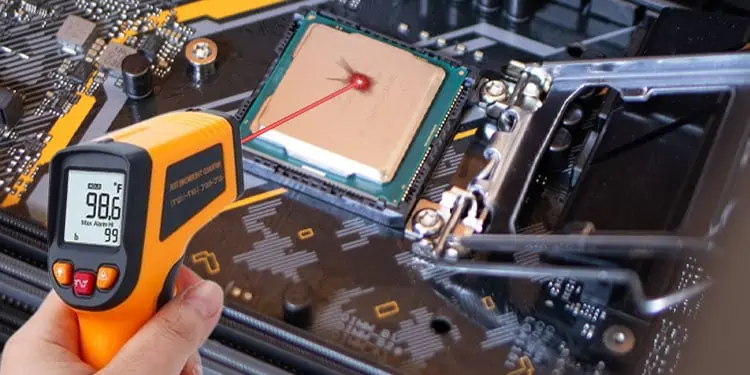
Keeping tabs on your CPU is one way to check the overall health of your system. Since the CPU handles all, if not most, processes, it is one of the components determining a PC’s health.
Even though you can monitor the temperature from BIOS, other vital information such as, its fan speed, core utilization and power consumption cannot be obtained with practical accuracy. Third party applications that are found on the internet offers you these feature.
However, only some of them will provide crucial CPU details with maximum accuracy. In this article, we have gathered some of the best CPU monitoring application that provides necessary and accurate CPU details depending on the users need.
Best Tools to Monitor CPU Temperature
The list of applications listed below offers application with variety of features like CPU temperature, CPU utilization, fan speed, etc. However, these applications may also take a good chunk of memory. Depending on your PC specification, you can use either a simple and light application or a sophisticated one that provides maximum system information.
Open Hardware Monitor
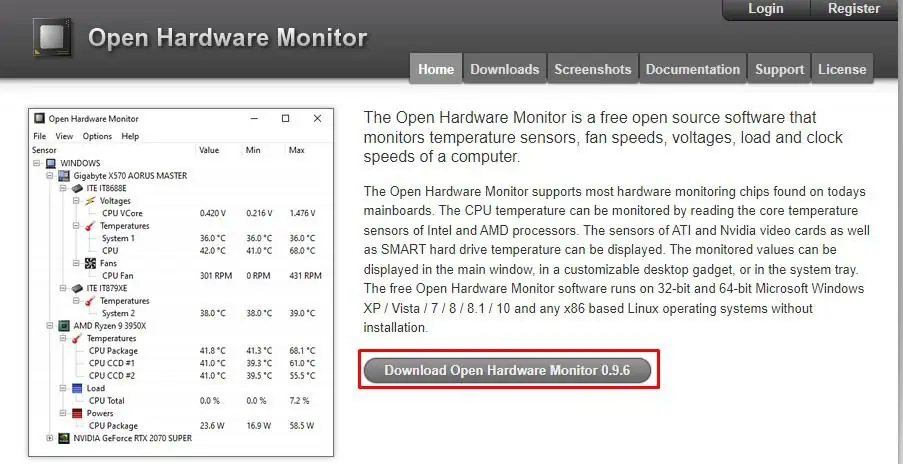
Open Hardware Monitor is a lightweight application that you can use for free, even for commercial use. Being an open source application, most CPU monitor applications like HWMonitor and CPU Temperature use the source code from Open Hardware Monitor to create an application with added features.
To get Open Hardware Monitor for your PC,
- Go to Open Hardware Monitor’s official download page and click Download Open Hardware Monitor.

- Extract the downloaded file and open the folder.
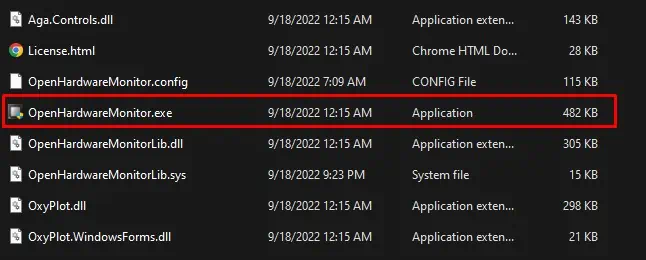
- Run OpenHardwareMonitor executable
(.exe)file to get your CPU temperature readings.
HWMonitor
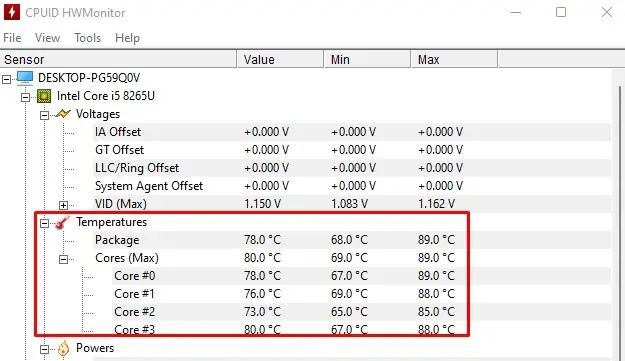
HWMonitor has a simple UI that can track all your system’s information. It uses source code from Open Hardware Monitor and some added features like measuring voltages to the processor, CPU temperature, processor utilization, and clock speed. Besides this, the application also has access to the S.M.A.R.T feature.
It can get details about all the storage devices connected to the system using S.M.A.R.T. This includes temperature, utilization, airflow, and speed (read rate and write rate). However, unlike other applications in the list, HWMonitor does not offer CPU fan control.
Downloading and installing the application is fairly simple.
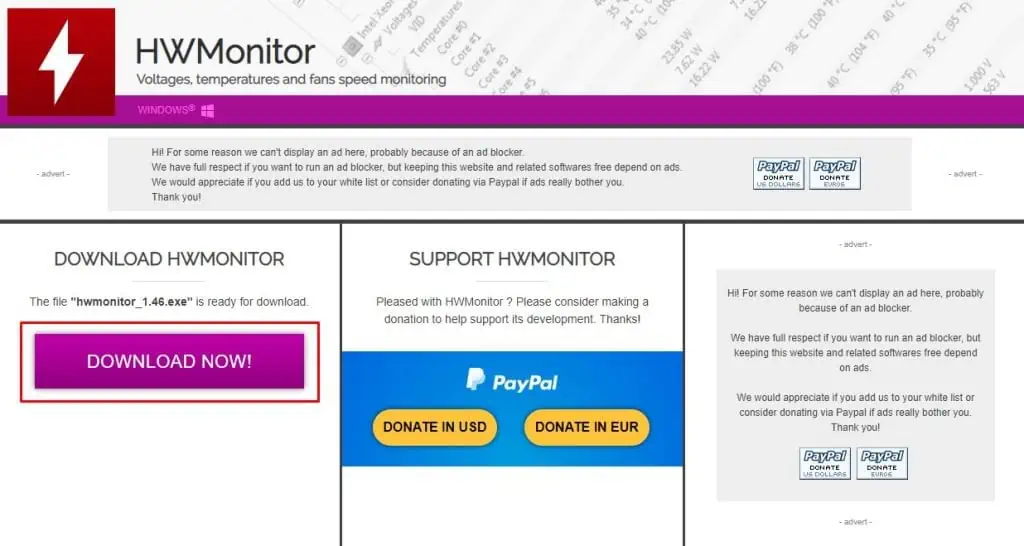
- Go to the CPUID official download center and download HWMonitor.

- Once the download completes, run the executable file and follow the installation steps.
- After the Installation is complete, run the application to get all the system details.

HWiNFO
Unlike HWMonitor, HWiNFO is a completely different application and not at all related to one another. HWiNFO is a slightly heavier application, as it provides even more detailed information about your hardware.
This information includes CPU ID, vendor, Code Name, Technology, Temperature, and many more. HWiNFO not only gathers the CPU’s details but can also access information about the system memory, motherboard, video adapter, monitor, audio, network, and ports.
If the simplicity of HWMonitor is not for you, you can use HWiNFO to get detailed information about the hardware.
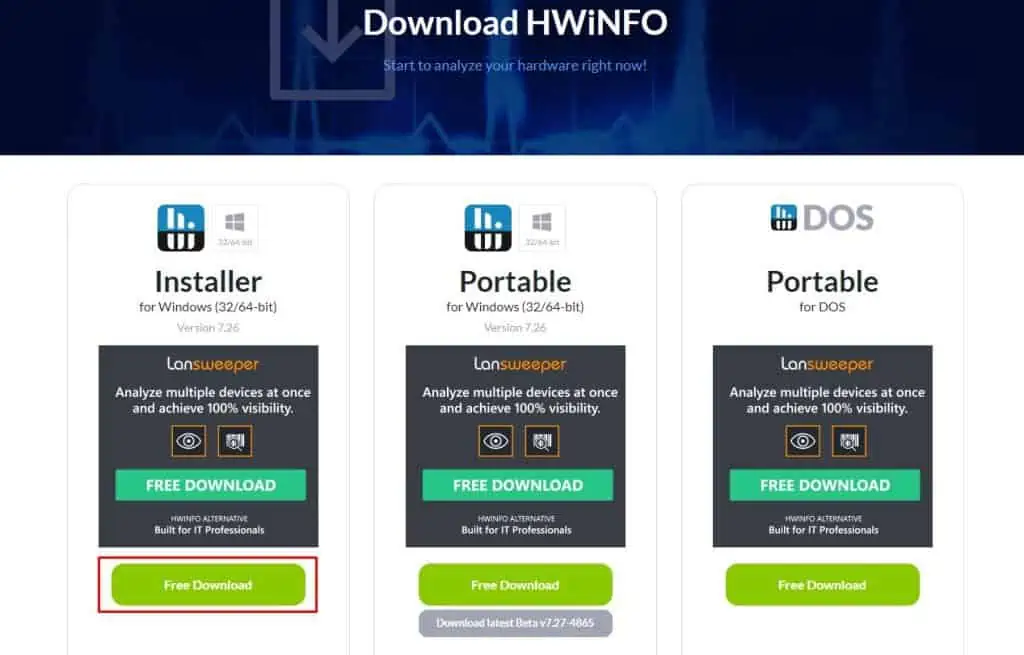
- Download HWiNFO from the official HWiNFO website.

- Run the executable file, follow the installation process and run the Application.
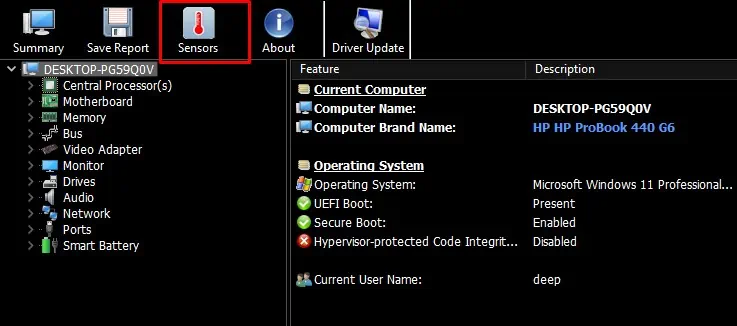
- Now, go to the Sensor tab.

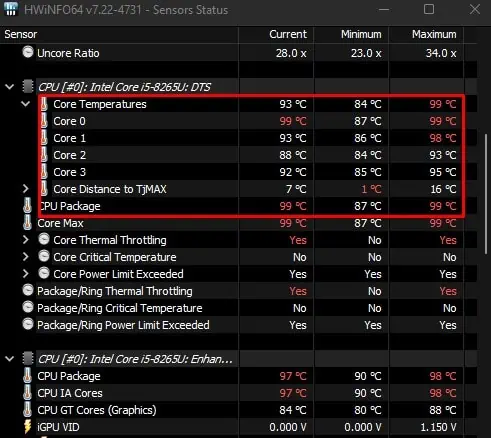
- Scroll down to see the core temperature.
- If you want to get the details about the CPU, expand Central Processors and click on the CPU listed inside. Here you can see all the detailed information about the CPU.

Core Temp
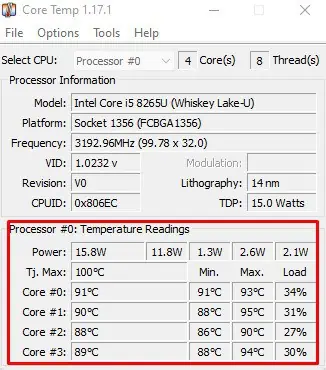
Core Temp is another lightweight application that gives you the CPU details along with the CPU temperature readings. The CPU details include CPU model, platform (socket), frequency, CPUID, and many more.
Besides temperature readings, it also shows you CPU power consumption. When reading CPU temperatures, Core Temp gives you a red exclamation mark to indicate that a core is running at an extreme temperature.
To monitor CPU temperature using Core Temp,
- Download Core Temp and install the application by running the executable (.exe) file.
- Simply run the application and check the Temperature Readings.

Speed Fan
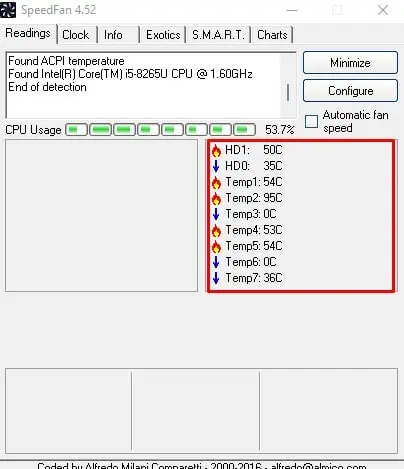
Speed fan is a great application to control fan speed in your system. Besides this, you can also use the application to read CPU, GPU, and storage device temperatures. The application also lets you get voltage readings, current FAN speed, and clock information in a simple and easy-to-read user interface.
To install the Speed fan,
- Download Speedfan and run the executable (
.exe) file. - Once the installation is complete, run the application.
- In the readings tab, you can see all the details about the PC.

RealTemp
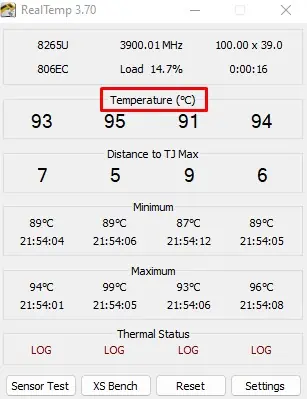
RealTemp is another lightweight application that monitors your CPU. It displays the minimum and maximum temperature reached on all cores, current temperature, and Distance to TJ max. To download RealTemp,
- Download the RealTemp zip file.
- Extract the file you just downloaded and run the RealTemp executable file.

MSI Afterburner
If you have a graphic card on your system, you most likely have heard about MSI Afterburner. Afterburner is an overclocking tool from MSI that also has a section that monitors hardware.
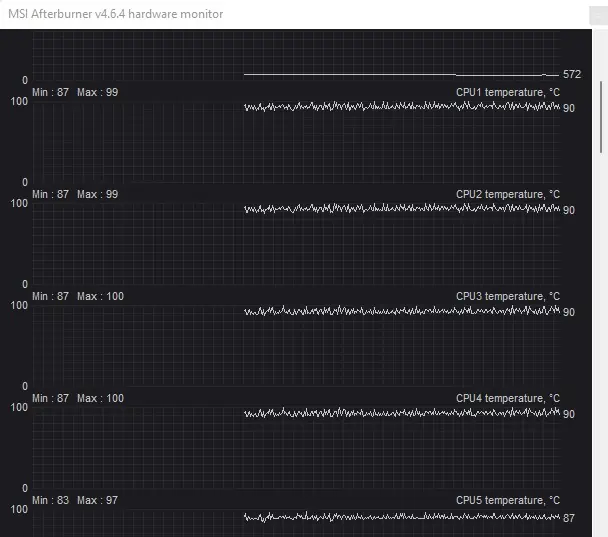
It allows you to check temperatures on all your cores, memory clock speed, memory, and GPU usage.
Although developed by MSI, you can install and run Afterburner on any PC, even the one with no MSI component.
- Download MSI afterburner from the official MSI download center.
- Install and run the application.
- The front page of MSI Afterburner contains the details about the system’s GPU.
- Click on the Monitor icon to view Hardware Monitor.

- Here, you can see the GPU temp, GPU usage, memory clock speed, and CPU temperature.

Corsair Link 4
Like MSI Afterburner, Corsair Link 4 is another hardware monitor application that works on any PC without Corsair hardware. It also lets you control all the fans connected to the PC. However, unlike MSI Afterburner, you cannot perform any overclock using Corsair Link 4.
- Download Corsair Link from the internet.
- Extract the downloaded file and run the executable file to install the application.
- Go to the installation location and run CorsairLink4.
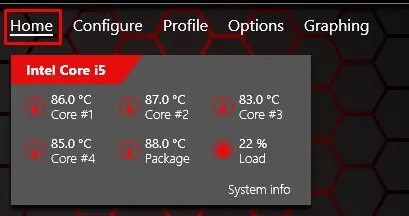
- Go to the Home tab to view the temperature on all your cores.

Check CPU Temperature on Mac
Most applications mentioned above do not support installation on a mac. Therefore, here are the steps to check CPU temperature on a Mac.
Using Terminal
You do not need a separate application to check your CPU temperature on macOS. You can view all your CPU cores’ temperatures using the Mac terminal.
The steps mentioned below is only applicable on Mac that uses Intel processor. If your Mac uses M1 or M2 processor, you may be out of luck as there is no feature that allows you to monitor CPU temperature without using third-party application.
- Press the Command + Space key and type terminal to open Terminal.
- Type
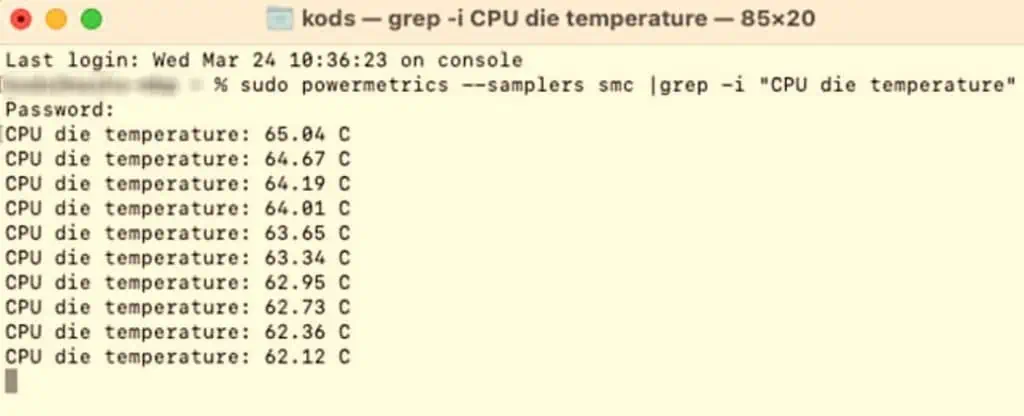
sudo power metrics --samplers SMC |grep -i "CPU die temperature"and press Enter.
- Enter the admin password and press Enter.
- CPU die temperature represents real-time CPU temperature readings
Macs Fan Control
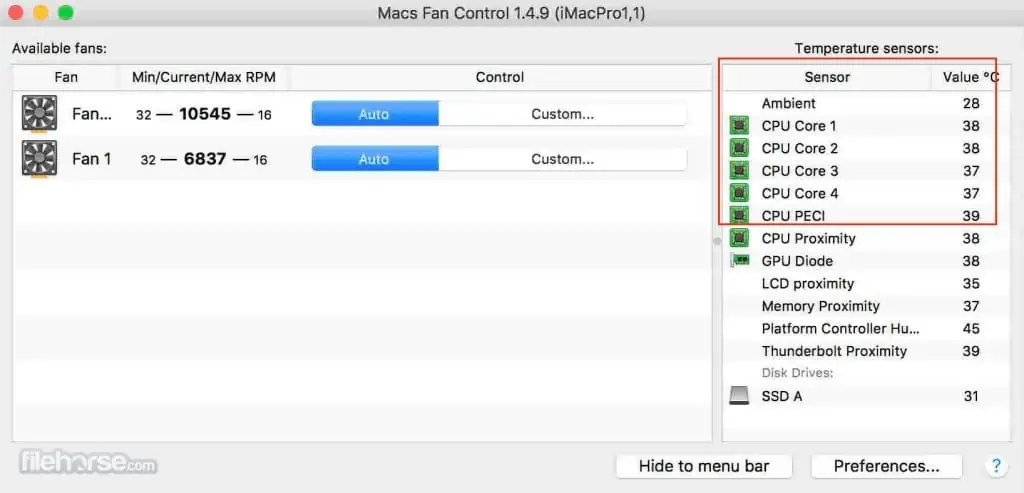
Macs Fan Control offers real-time temperature and fan speed monitoring. It also lets you control fan speed. Besides this, it also has a customizable fan speed preset.
- Launch the App store and search Macs Fan Control to download Macs Fan Control.
- Click on Get to install Macs Fan Control on your macOS.
- One the installation is complete, run the application.


