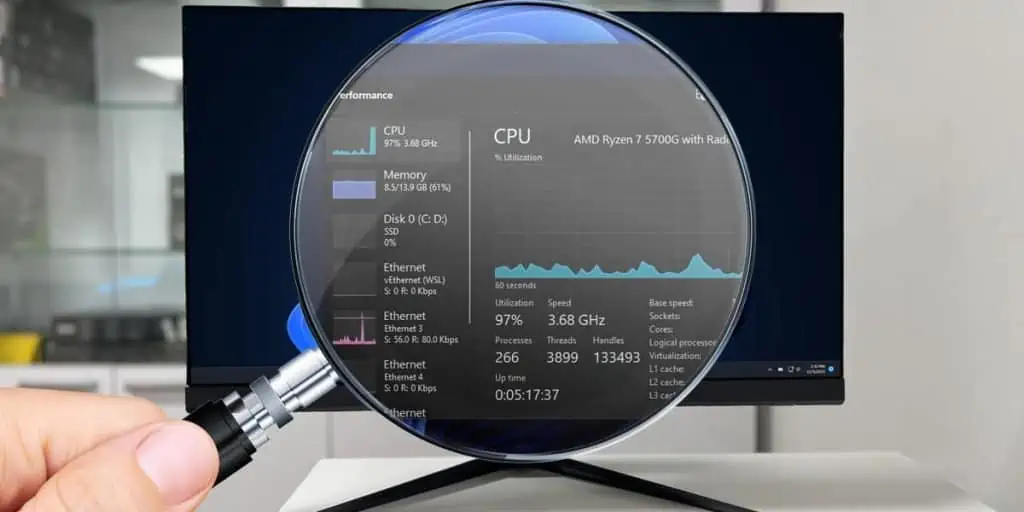
The Task Manager reports CPU usage stats overall, per process, per user, and per logical processor. It’s the best way to check the CPU usage in Windows for most users.
On my overclocked MSI system, I like to monitor the CPU usage and other stats in-game. For this, I use programs like MSI Afterburner.
As you can see, different methods are useful in different scenarios. And since Task Manager is generally the most useful, I’ll start with that.
Using the Task Manager
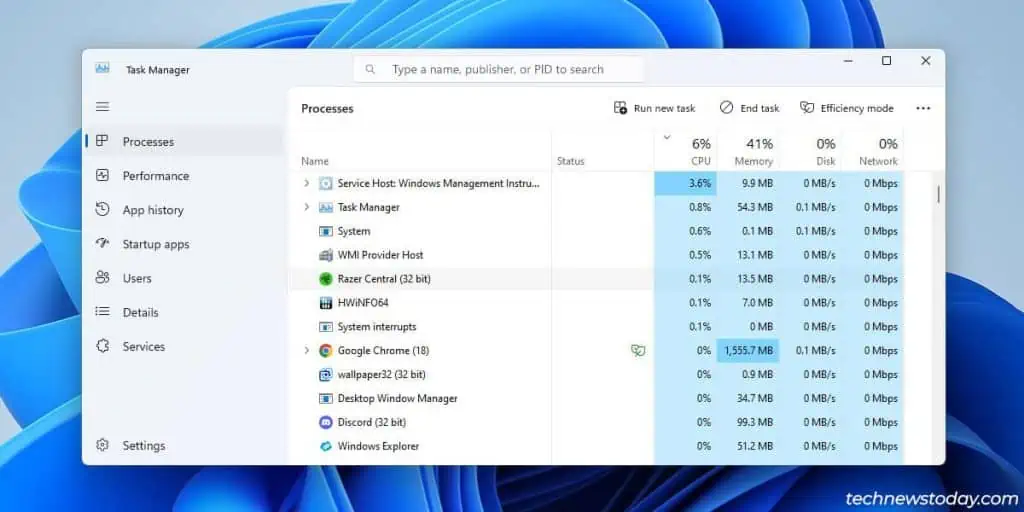
Press Ctrl + Shift + Esc to launch the Task Manager and check various CPU usage stats like so:
- In the Processes tab, check the current CPU utilization across all cores per process. You can sort the processes by CPU usage as well.

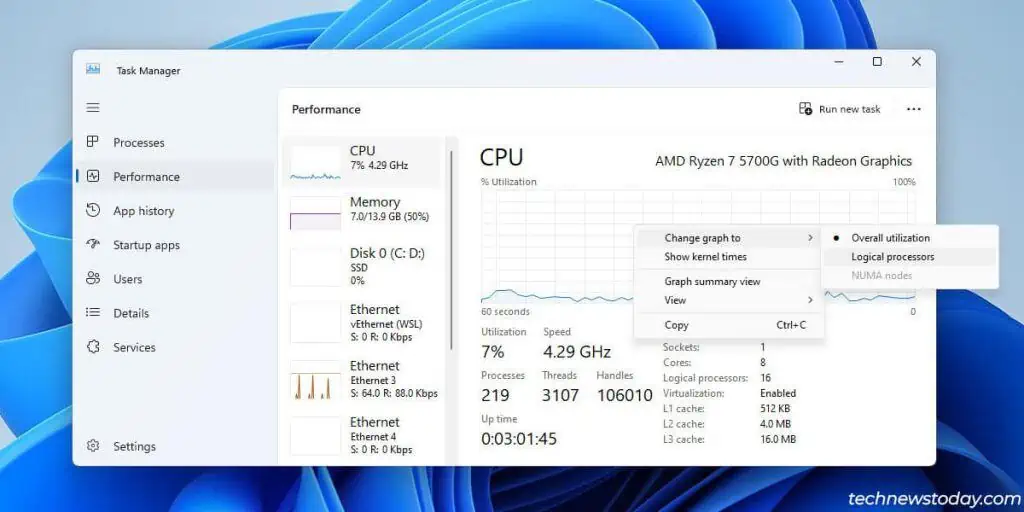
- The Performance tab displays the overall CPU usage for the last 60 seconds. You can right-click the graph and change it to display CPU usage per logical processor.

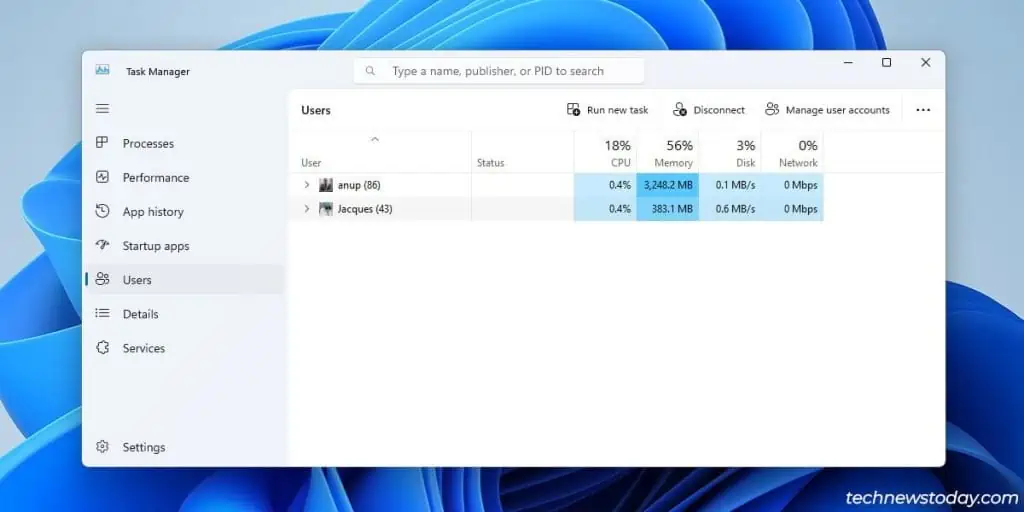
- You can also check CPU usage per user from the Users tab. This is useful if multiple users are currently logged in.

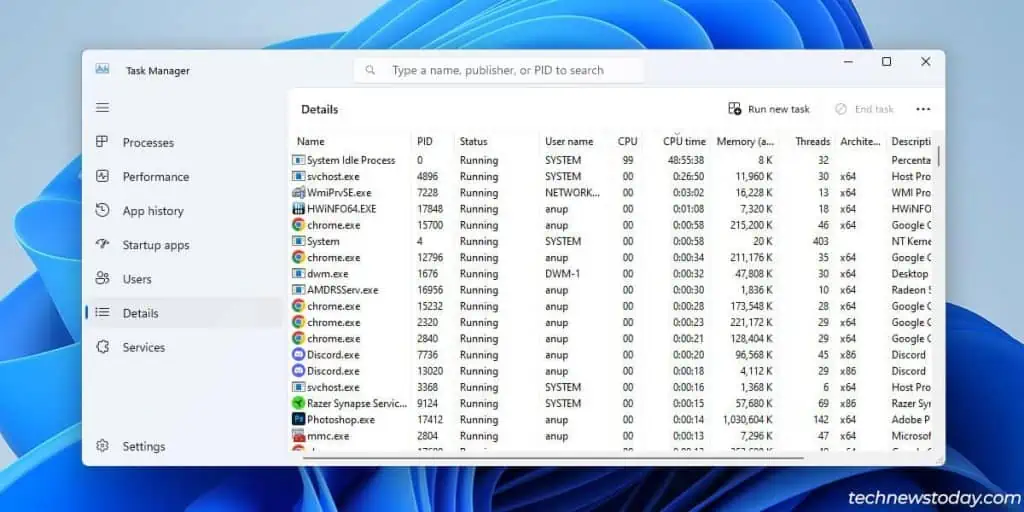
- If you want long-term data, you can check the CPU time from the App History or Details tabs. This shows the amount of time a process has used the CPU since it started.

Using Xbox Game Bar
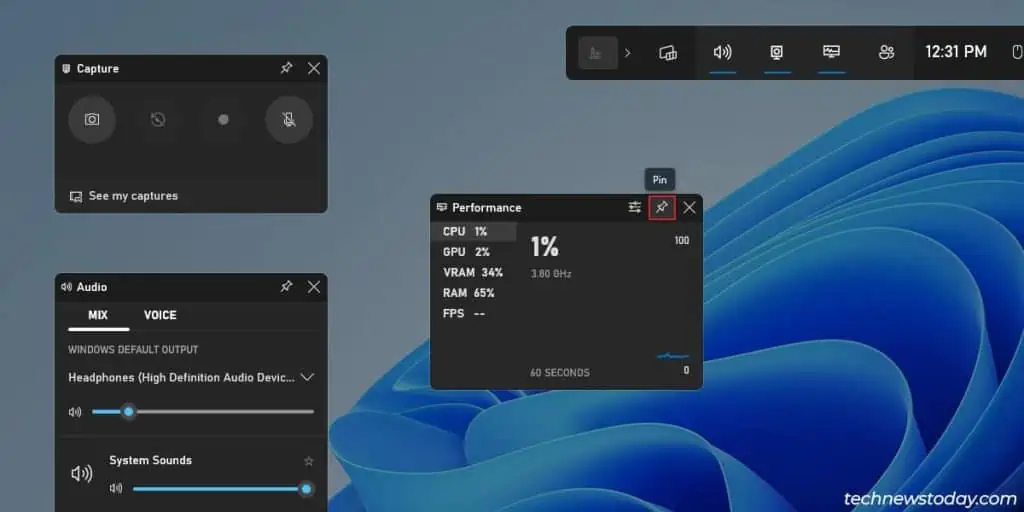
The Xbox Game Bar comes preinstalled in Windows 11. It’s handy if you want to monitor the CPU usage and other performance stats in-game.
- Press Windows + G to toggle it on.
- You can click anywhere or press Win + G again to toggle it off.
- Press the Pin button if you want to view the performance counter in-game.
Using the Performance Monitor
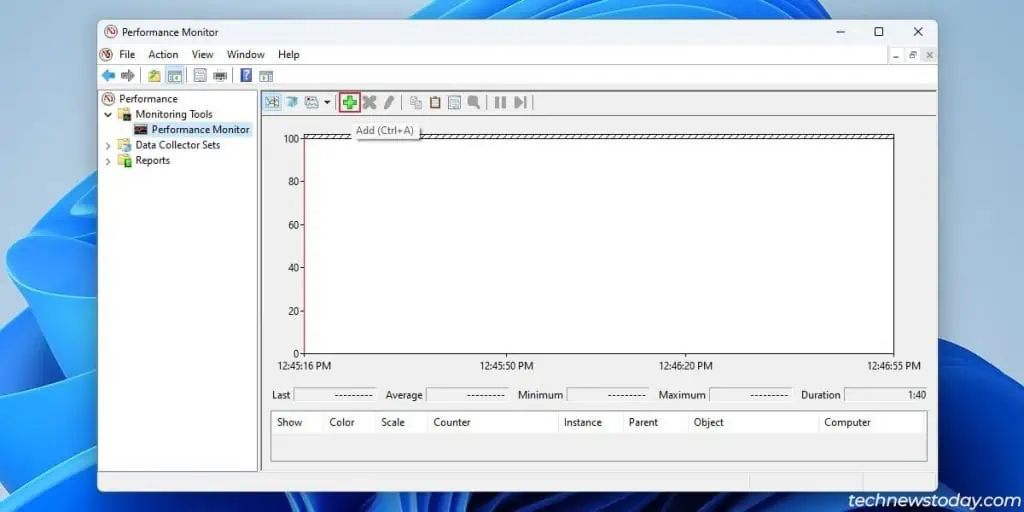
The Performance Monitor lets you log CPU usage per process for an extended period. This is useful if you’re trying to troubleshoot high CPU usage.
- Press Win + R, type
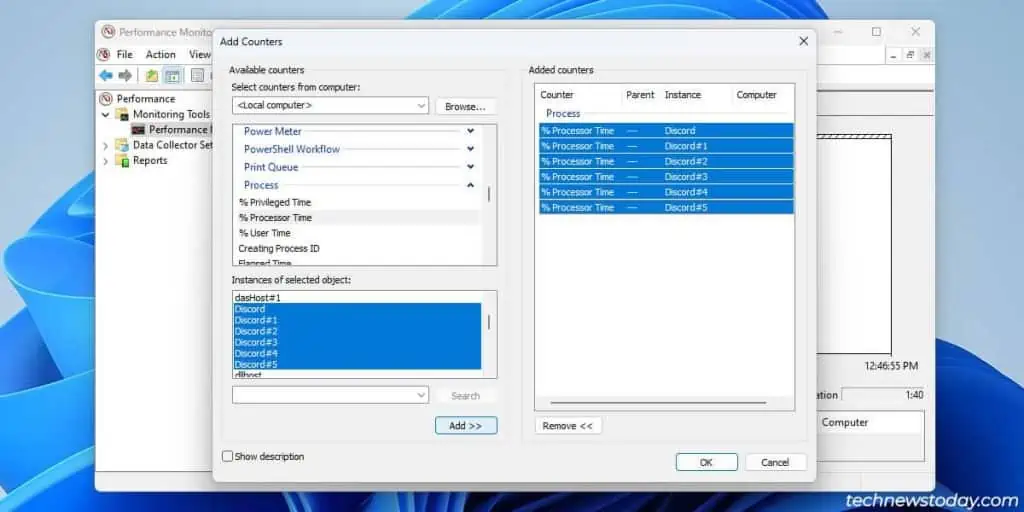
perfmon, and press Enter. - Select the Performance Monitor tab and click on the Add Counter button.

- Expand the Process section.
- Select All Instances if you want to monitor every process. Otherwise, select the exact processes that you want to monitor and click on Add.

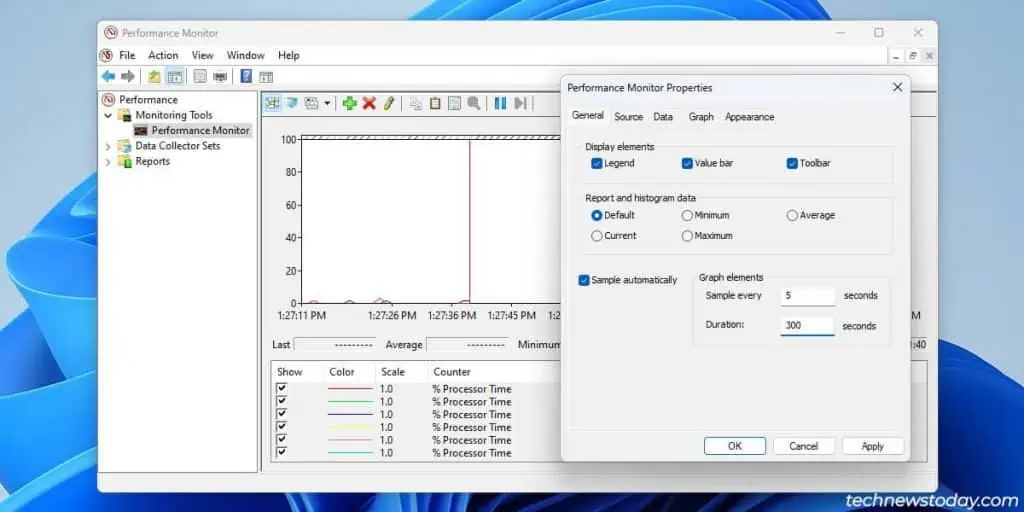
- Right-click on the graph and select Properties.
- In the General tab, you can change the Sample rate and the Log duration.

At this point, continue with your usual tasks and let the Performance Monitor log the CPU usage in the background. If you experience degraded performance or crashes, you can now check the log to determine what caused those problems.
From the Command Line
If you’re on Windows Server or simply prefer a CLI approach, you can use different commands to check the CPU usage. To start, press Win + X and select the Terminal.
Check the total CPU usage with:
Get-CimInstance win32_processor | Measure-Object -Property LoadPercentage -AverageYou can run this one-liner in a loop to refresh the data every second. Press Ctrl + C afterward to exit the loop.
While(1) { Get-CimInstance win32_processor | Measure-Object -Property LoadPercentage -Average}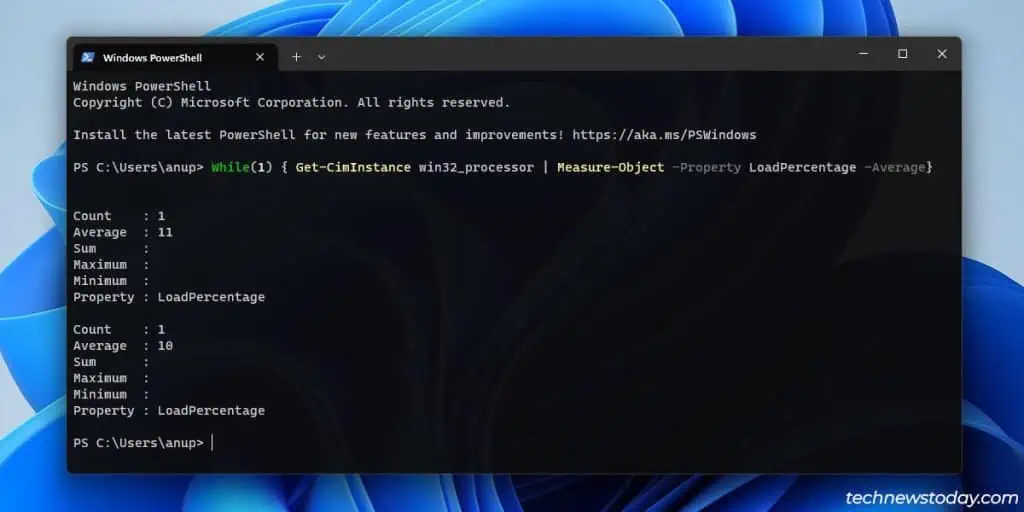
Instead of overall, you can check the CPU usage per process as well. Change the value of Select-Object -First (30 in this case) according to how many instances you want to monitor.
Get-Counter '\Process(*)\% Processor Time' | Select-Object -ExpandProperty countersamples| Select-Object -Property instancename, cookedvalue| ? {$_.instanceName -notmatch "^(idle|_total|system)$"} | Sort-Object -Property cookedvalue -Descending| Select-Object -First 30| ft InstanceName,@{L='CPU';E={($_.Cookedvalue/100/$env:NUMBER_OF_PROCESSORS).toString('P')}} -AutoSizeAnd like earlier, you can add a loop to refresh the stats every second. Press Ctrl + C to exit the loop when satisfied.
While(1) { Get-Counter '\Process(*)\% Processor Time' | Select-Object -ExpandProperty countersamples| Select-Object -Property instancename, cookedvalue| ? {$_.instanceName -notmatch "^(idle|_total|system)$"} | Sort-Object -Property cookedvalue -Descending| Select-Object -First 50| ft InstanceName,@{L='CPU';E={($_.Cookedvalue/100/$env:NUMBER_OF_PROCESSORS).toString('P')}}} -AutoSize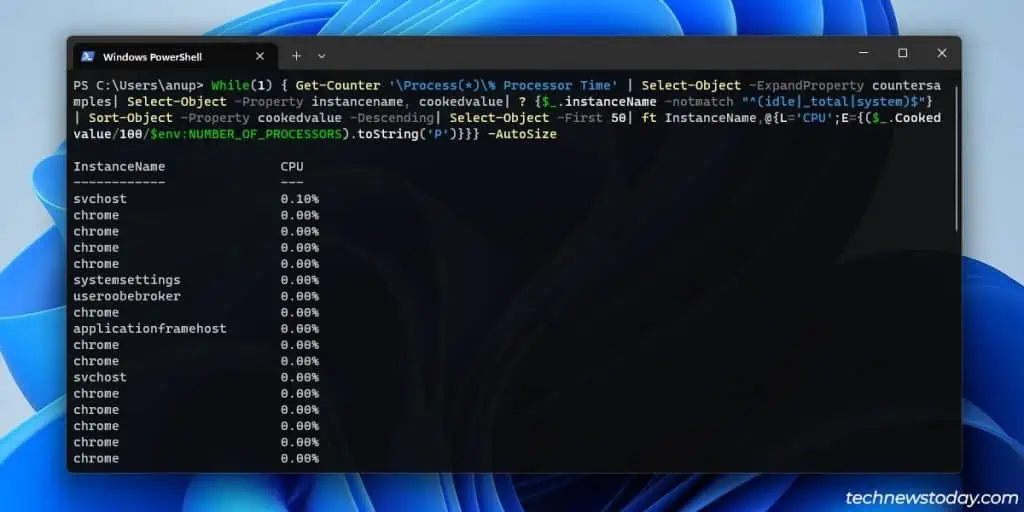
htop to monitor the CPU usage from the terminal.Using Third-Party Tools

I like to play around with overclocking and undervolting to find the sweet spot between raw performance and a smooth, quiet system.
I mainly use HWiNFO to monitor my system stats when doing so. It takes the CPU usage data reported by the Task Manager and displays utilization per logical processor in % format.
Or, if you want to monitor performance stats in-game and the Xbox Game Bar doesn’t cut it for you, MSI Afterburner is a great alternative.
I use Afterburner’s profiles to quickly switch between an overclock or undervolt as needed. The hardware monitoring is a bonus for me.

