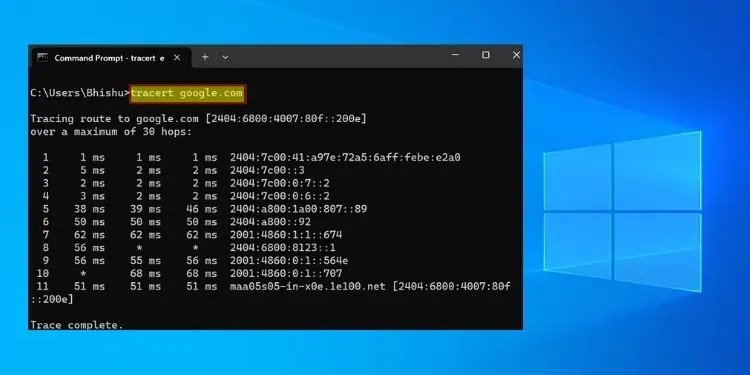
When troubleshooting network-related problems, running a traceroute command can help detect where (in the route) the connection has become slow or unresponsive. It works by sending ICMP echo packets to the destination and tracking every single hop (usually router/gateway) on its way.
After executing the tracert command on Windows, the round-trip time of every packet along with the hop’s IP address/hostname is displayed. Analyzing this output, you can now get a general idea of which hop could be facing the trouble.
In this article, I will guide you on how to properly use the Traceroute command on Windows.
Basics to Traceroute Command
Most of us have used the ping command to test the reachability of our devices on the network. While this is an effective utility to detect possible network anomalies, it’s limited to telling the user whether the specified destination is reachable.
Like Ping, the Traceroute or Tracert command also runs on the third layer of the OSI model. It sends ICMP request packets to the destination host. The main difference is that it doesn’t just specify whether the server can be reached but also displays the exact route.
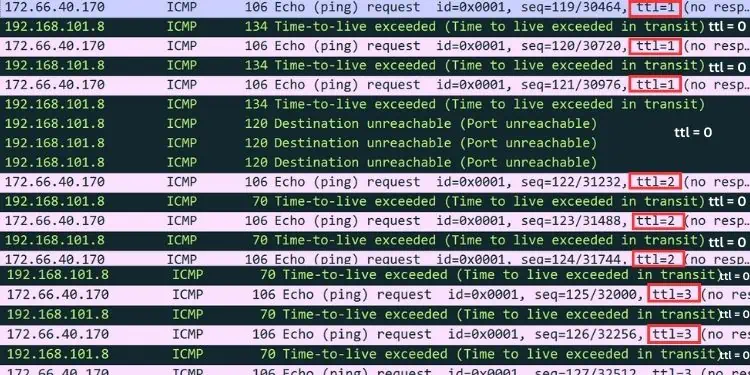
Traceroute uses Time-To-Live (TTL) values which decrease (by 1) every time the packets reach a hop. When the value is 0, that router/gateway responds with an ICMP reply packet.
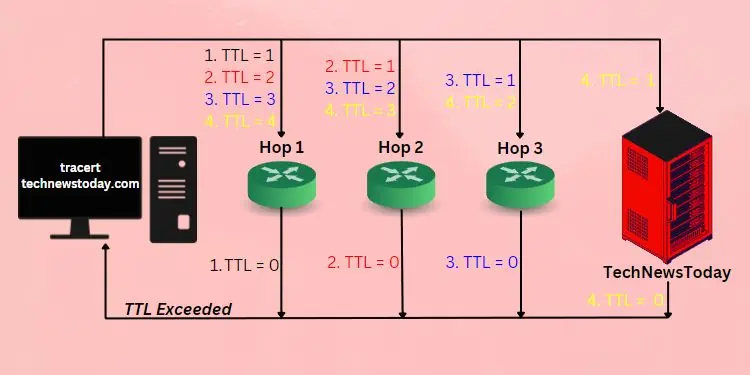
Let’s understand this with a simple example. Suppose you’re trying to track the route of our site, TechNewsToday. Once you execute the Traceroute command, three ICMP packets from your device are forwarded to our server with TTL = 1.
Once it reaches the first hop, the TTL value decreases by 1 (now TTL = 0) and replies with a “TTL exceeded” message. Then, your device displays the round-trip time (in ms) of every packet along with the hop’s IP/hostname.
With the noted IP address, it resends the ICMP packets with TTL = 2. Again, the value is decreased by 1 (now TTL = 1) and the packets are forwarded to the destination server.
After the request message hits the second hop, the value is again decreased by 1 (now TTL = 0). As earlier, this router replies to your source device with the “TTL exceeded” message. The process repeats until the final destination is reached. On its way, it keeps on displaying the round-trip time and IP of each hop.
In Windows, the default maximum number of hops the packets can travel is 30. Thus, once the hop counter reaches the limit, the packets are dropped and the final route can’t be found. But you do not need to worry as it’s possible to increase this number using a dedicated parameter, which I will discuss later.
How to Run Traceroute Command?
To determine the route of the ICMP request packets from your source device to the destination, you need to execute the tracert command. The syntax is the same for both Command Prompt and Powershell.
Syntax: tracert <switch> <destination IP or hostname>
Running just the tracert command executes its help command. You may directly learn about its usage and the various switches available. For your comfort, I have compileded all the available options with their functions in the table below.
| Traceroute Switch/Option | Function |
| -d | Discards DNS lookup (only displays the IP address) |
| -h <max number of hops> | Lets you change the maximum number of hops to reach the destination |
| -j <host list> | Based on the specified hosts (max = 9), the ICMP request messages will use the loose source route (only when using IPv4 addresses) |
| -w <time> | Based on the specified time (in ms), your device waits for the ICMP reply message (if no reply, * is displayed) |
| -R | Traces the round-trip path (only for IPv6 addresses) |
| -S <source address> | Manual specification of the source address (only for IPv6 addresses) |
| -4 | Force use IPv4 address to trace the route |
| -6 | Force use IPv6 address to trace the route |
| /? | Executes help command for Tracert |
For demonstration, I’m going to trace the route of our site, TechNewsToday.
To do so, I need to open Command Prompt and execute tracert technewstoday.com.
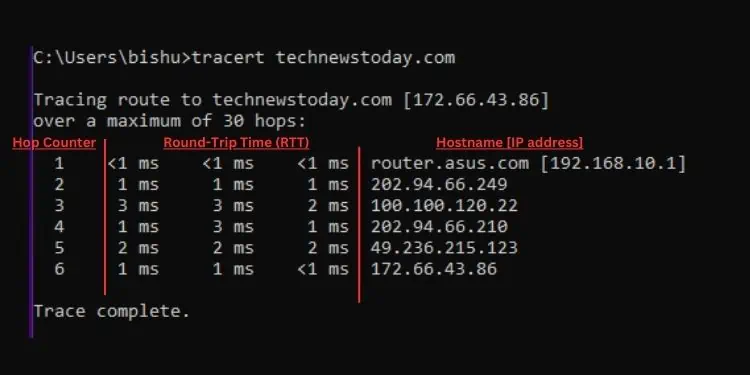
Unlike Ping, this command takes comparatively more time to display the related results. As mentioned earlier, it only searches for a maximum of 30 hops by default.
The first column is regarded as the hop counter. It displays the total number of hops hit before reaching the specified destination.
The next three columns output the round-trip time (in milliseconds) of each data packet. Well, RTT is the time that a packet took to hit a hop and return back. Note that the time increases with every step. Its explanation is quite simple—the further the hop, the longer it takes for the ICMP requests to reach and return.
The final column presents the IP addresses of every hop on the route. If these hops have resolved hostnames, they should be displayed on the left of the IP address.
As stated in the table above, you may execute tracert -d technewstoday.com to discard the hostnames. This lists only the IP addresses of each hop in the route (from the source device to TechNewsToday).
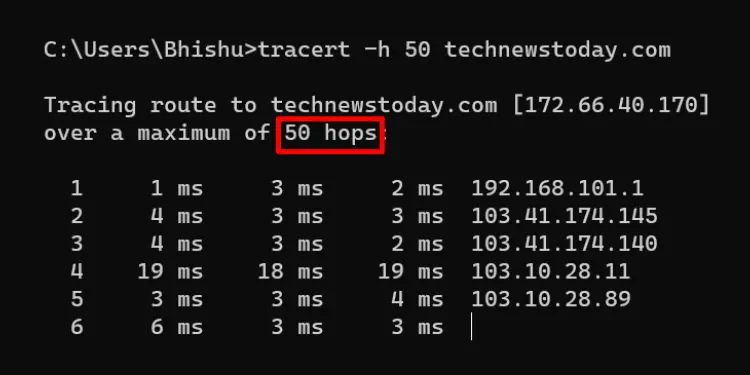
Likewise, you may execute tracert -h <number> <destiation> (for example, tracert -h 50 technewstoday.com) to increase the number of maximum hops to search for the destination. I recommend running this command if the hop counter reaches 30 as in such cases, the ICMP request packets get dropped without reaching the destination server.
In a similar way, you may test the other switches as per their syntax and descriptions I’ve included in the table above.
Additional Tip
While the same command works fine in the Windows Powershell window, here’s an alternative cmdlet to run traceroute:Test-netconnection -traceroute <destination IP/hostname>
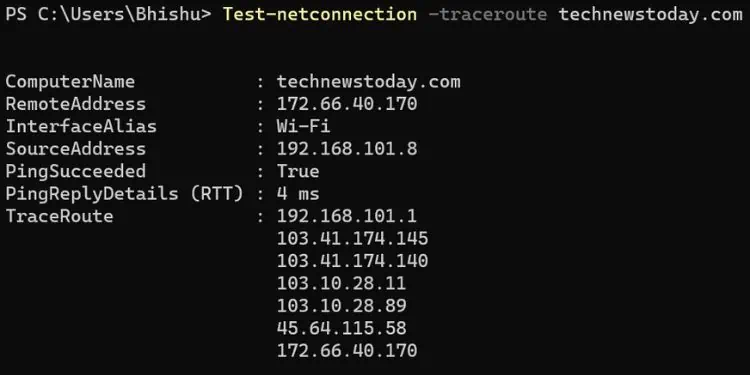
For example, if I run Test-netconnection -traceroute technewstoday.com, it takes a few seconds to load the following output:
- ComputerName: Displays the destination’s hostname (the same thing that you entered in <destination IP/hostname>)
- RemoteAddress: Displays the assigned IP address
- InterfaceAlias: Your adapter name
- SourceAddress: Your device’s assigned IP address
- PingSuccedded: Displays the boolean value (True if ping succeeds and False if it doesn’t)
- PingReplyDetails (RTT): Displays the average round-trip time
- TraceRoute: Displays the IP addresses associated with each hop (maximum = 30)
Troubleshooting Network Issues Using Traceroute
The Traceroute command can help locate the point of network failure, especially in large networks where several paths may lead to the same hop. You can compare the round-trip time of each packet and possible error messages in the IP column.
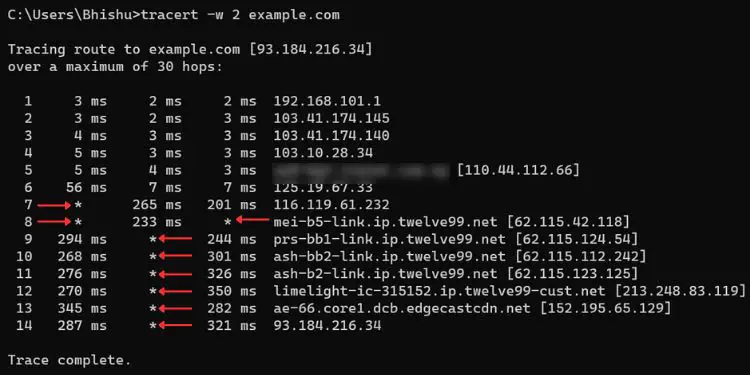
In most cases, you’ll notice an “*” symbol in the packets column. This simply indicates packet loss and usually happens when the hop (router) in the path failed to respond to the ICMP request message.
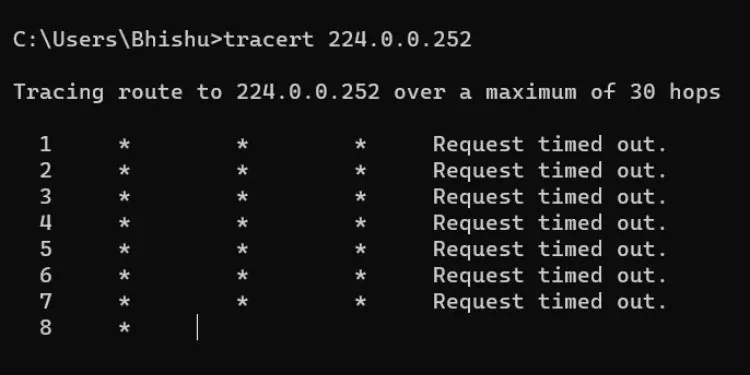
In case all three packets display the “*” symbol, it is followed by the “Request timed out” error. If that happens, you can have a general idea that there’s an issue with that particular router or its related connection.
While this can happen in only one of the hops, it’s also possible that all the succeeding hops suffer.
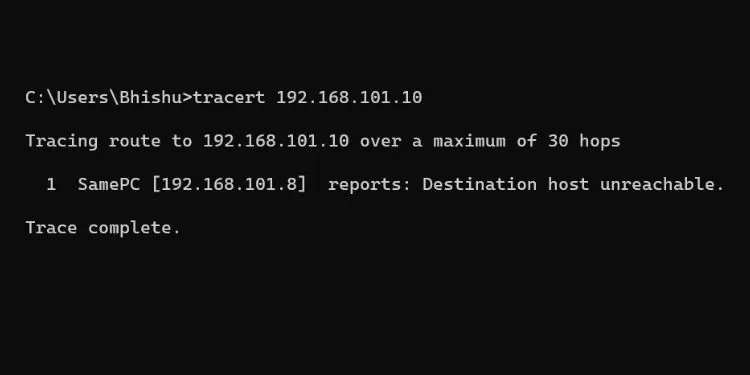
In case the pinged device/server is unavailable or there’s an IP-related issue, the Tracert command might display “Destination host unreachable”. Follow this complete guide that should help solve this issue.
If you’re facing network issues and the Traceroute command doesn’t show any of the mentioned errors, you can even check the latency delay (in the RTT columns). An increased latency toward the destination doesn’t always indicate an issue. However, you can predict the point of failure if the packets reaching the same hop have varying latencies.
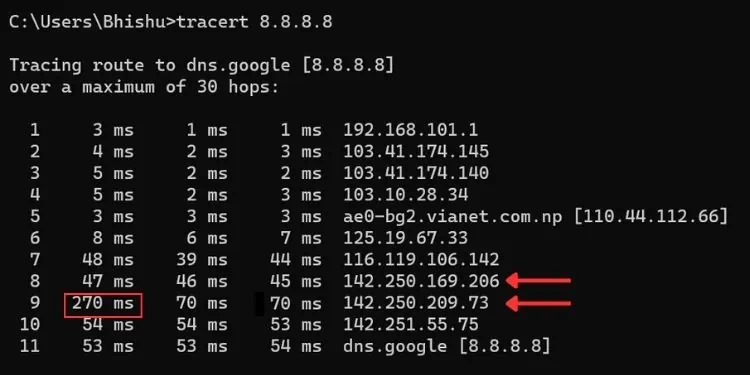
For instance, if the packets at a certain point display 47 ms, 46 ms, and 45 ms, there’s nothing wrong here. But if you see 270 ms, 70 ms, and 70 ms, you can now note that there’s some sort of problem with this hop.
Another common problem is timeouts or high latency problems during the beginning or at the end hops. If you see issues in the first few hops, it’s indicating a problem with your local network. On the other hand, errors at the end potentially mean issues with the destination host.
The Traceroute command isn’t meant to actually solve a networking problem. It’s rather a way to find potential issues that the ICMP packets might have experienced when traveling from the source device to the destination host.
Indeed, it’s possible to troubleshoot the related issues if it’s on the local network or an accessible destination device. But if you’re tracing the route of a global site, there’s nothing much you can do.

